O’Reilly’s Strata 2012 “Big Data” Conference in Santa Clara, CA

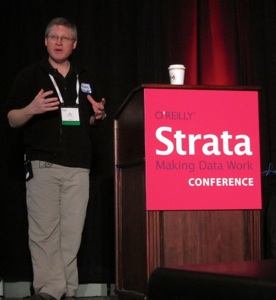
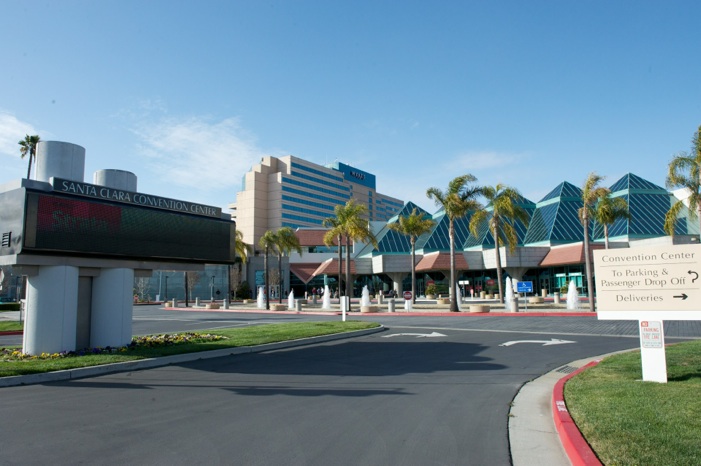
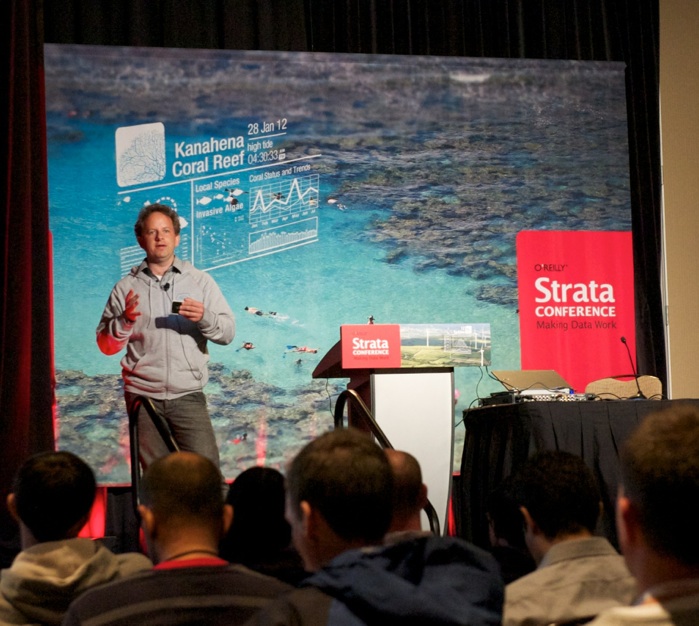
On Tuesday, February 28th 2012, the O’Reilly’s Big Data conference kicked off in the Santa Clara Convention Center. About 2,000 data scientists, researchers, business people converged to this spot to learn about the latest and greatest in the world of Hadoop, HBase, Hive, Pig, ... . According to Wikipedia Big Data consists of datasets that grow so large that they become awkward to work with using on-hand database management tools. Difficulties include capture, storage, search, sharing, analytics, and visualizing. The first (pre-conference) day mainly consisted of tutorials ranging from Hadoop, predictive modeling algorithms to data visualization. I personally attended “large-scale web mining” by Ken Krugler (@kkrugler on Twitter, Scale Unlimited, see pictures below). He discussed the three aspects of web mining: Crawling, Extracting, and Processing. Ken zoomed in on the specifics of focused crawling. Next, he ran through detailed hands-on worked-out examples. Many participants particularly appreciated the many detailed answers he gave to practical questions about issues that may arise when web crawling large amounts of pages (e.g., Javascript on webpages).
Thursday 1 March 2012
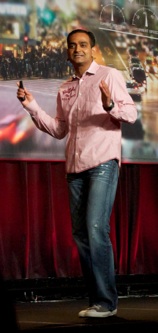
Next, I jumped to the “Introduction to R for data mining” session by Joseph Rickert (@RevoJoe, Revolution Analytics, see picture to the right). He shared a lot of very useful ready-to-use R scripts from the beginner’s type to the ones for the real pros (e.g. a visualization script of a dendrogram showing variable correlation clusters). Simply great! In between sessions, yours truly (see picture below taken just outside the convention center building) enjoyed the California sun (at least on the first day, the other days, it was raining).
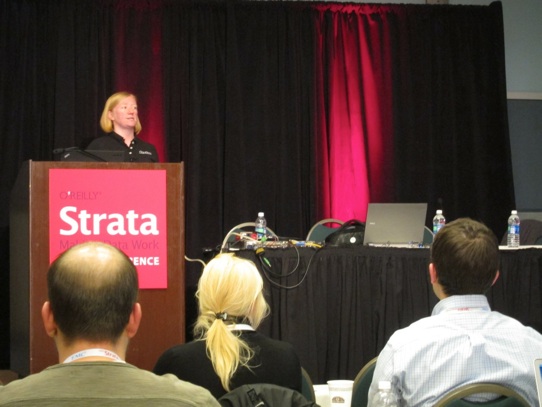
Another nice aspect of this conference was that all lunches and coffee breaks were sponsored, so no need to run around for food or drinks. In the afternoon, I decided to plunge full force into ‘Big Data’ with the lecture titled “Developing applications for Apache Hadoop” by Sarah Sproehnle (Cloudera Inc., see picture below). She is a true expert in the field, and is able to make even complex matters sound simple. My personal takeaways from her talk are: Hive (as an interesting layer on top of Hadoop and HBase to transparantly execute SQL-like statements on Hadoop clusters), Pig (alternative to Hive, but with different syntax and other key strengths), Mahout (a machine-learning library that leverages the parallel architecture both in terms of data as well as processing).

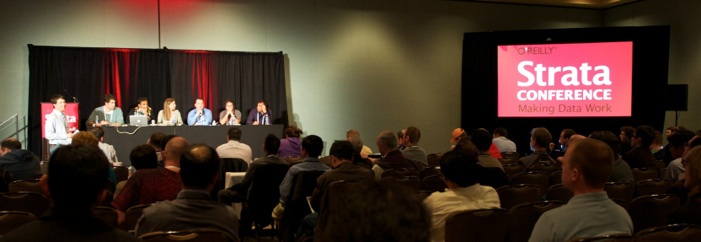
Finally, I had a quick peek into panel session discussing the topic which one of the two is most important: domain knowledge or data science knowledge. The answer depends on who you ask of course.
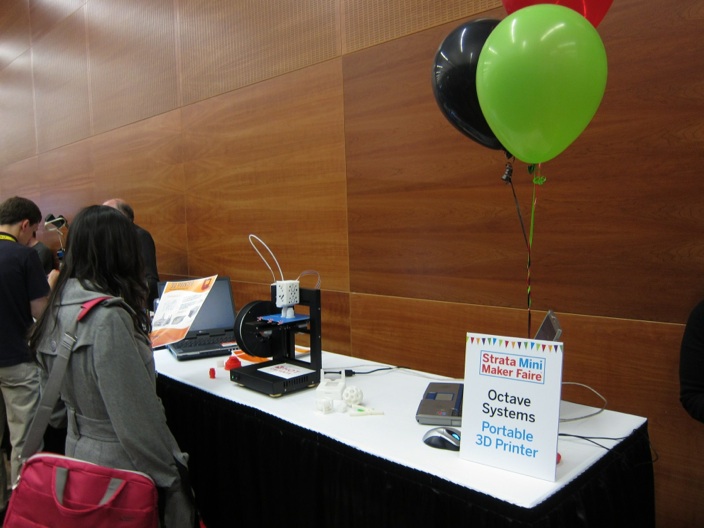
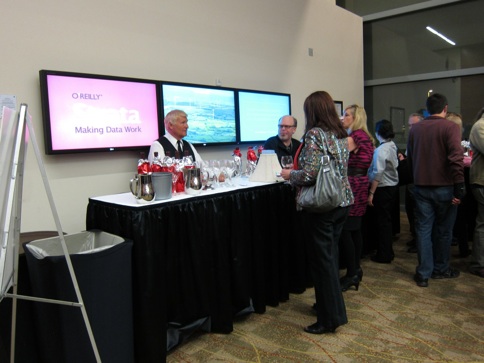
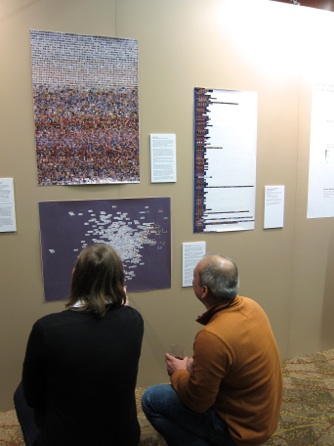
The Strata mini Maker Faire + Wine tasting contest closed the first day. They showed cool portable 3D printers (see picture below), robots, ... as well as some “techology-inspired” art (see below).
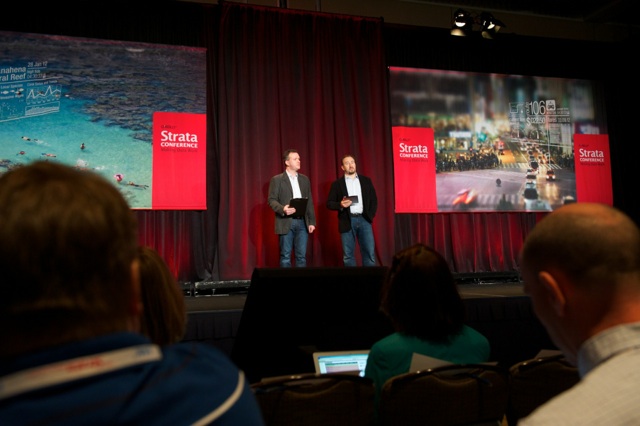
The real conference started on Day 2. Below, you see Edd Dumbill (@edd, O'Reilly Media, Inc. ) and Alistair Croll (Bitcurrent) welcoming attendees.
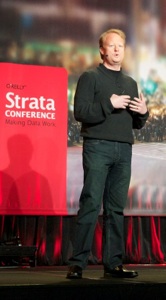
Then, the conference opened with a series of short plenary talks. Doug Cutting (@cutting, Cloudera, left picture below) kicked off the series of talks speaking about the Apache Hadoop ecosystem (discussing the open source philosophy at Apache). Dave Campbell (Microsoft, right picture below).
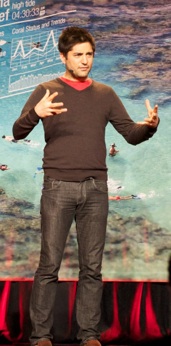
From left to right (pictures below): Abhishek Mehta (Tresata) talked about geodemographic segmentation. Mike Olson (Cloudera) discussed how big data can be used to solve big problems (e.g. fighting crime by predictive policing), Steve Schoettler delivered an inspiring talk about the new opportunities in education (Junyo). Avinash Kaushik (Market Motive)
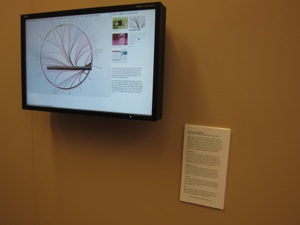
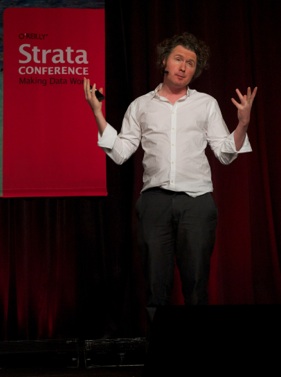
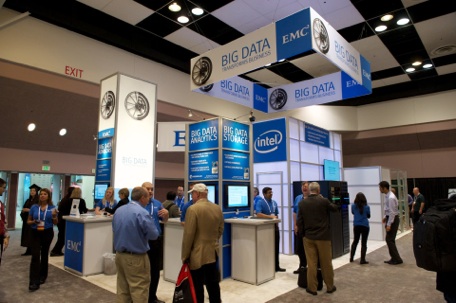
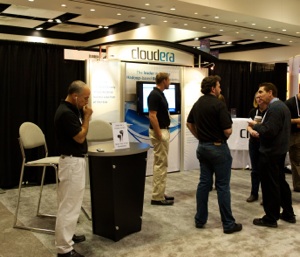
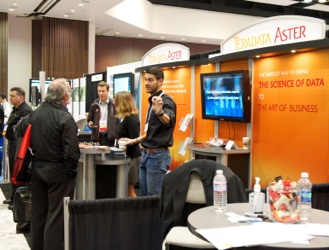
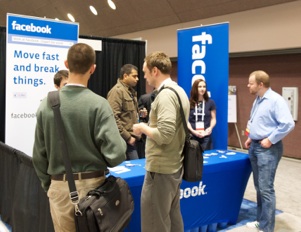
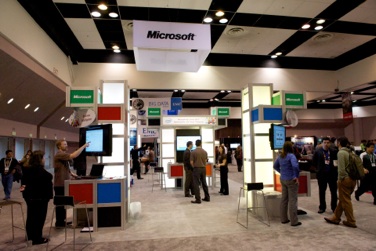
The final (probably most scientific) plenary speaker was Ben Goldacre (Bad Science, see picture below). He talks about the problems in the publication process of medical results (click here for the video). Then, the Expo floor was opened. Here are some visual impressions:

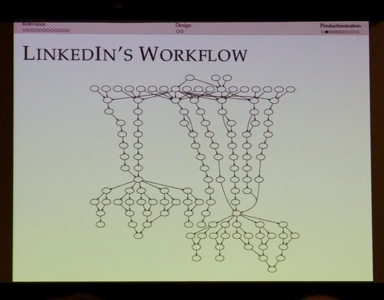
In the afternoon, I attended “Collaborative Filtering using MapReduce” by Sam Shah (@sam_shah, LinkedIn, see picture below). He was willing to share a lot of practical insights. To me, the most interesting one is the use of batch schedulers to create complex workflows. Examples of such workflow management tools are: Azkaban and Oozie. He also pointed to a great resource: http://sna-projects.com. The picture on the right (below) shows LinkedIn’s complex workflow.
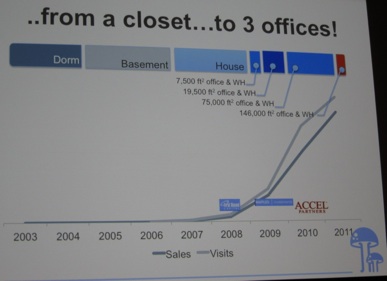
Next, I attended the talk titled “Analytics in a Community-Driven Fashion Retailer” by Kuntal Malia and Kate Zimmerman (both from ModCloth, see picture below), an online community-driven retailer democratizing fashion of vintage-inspired apparel. Their story was not really a big-data story, but still an interesting talk about the amazing growth (see slide below) of an e-retailer using crowdsourcing to vote on clothing when deciding on production volume.
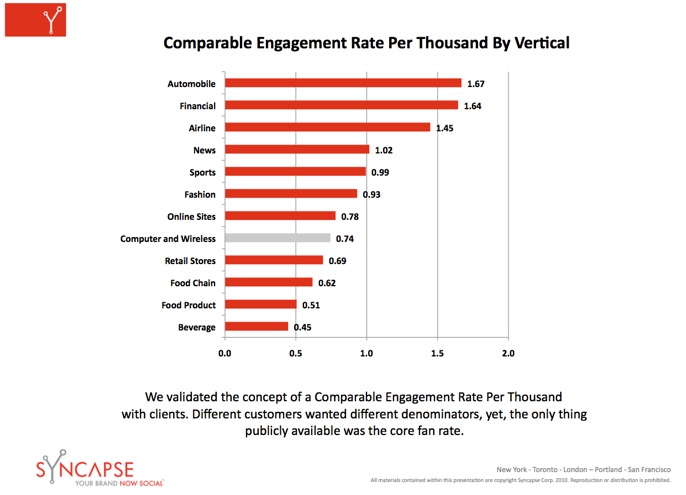
Next, Christopher Berry (Syncapse) presented “Data Science in Marketing Analytics“. He mainly talked about his experience building a marketing metrics system for online engagement. Challenges include unstable data sources, changing requirements, definitions being constantly updated, new feature requests.
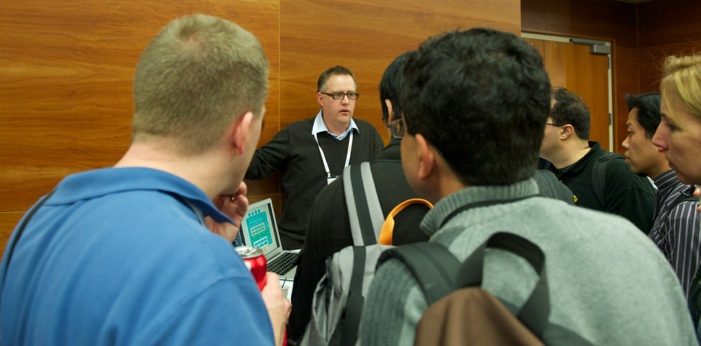
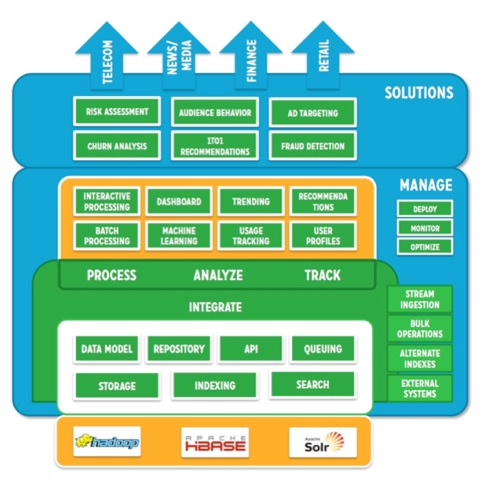
The final activity of Day 2 was the “Strata 2012 Startup Showcase”. Ten startups presented their concept. My personal favorite was NGData with their Lily big data management platform fusing Hadoop, HBase (as the underlying datastore) and Solr (as an index/search service, see slide below). Steven Noels (@stevenn, see picture below) specifically highlights the real-time aspect. Other tool vendors provide similar functionality, but do everything in batch model, whereas Lily offers real-time capabilities. NGData positions Lily as a Big Data management platform in four specific domains: retail/ecommerce, finance, news/media, and telco.
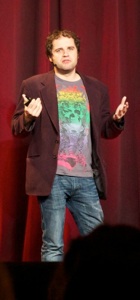
Day 3 at Strata 2012 again started with several keynote speakers (see pictures below from left to right). First, Jonathan Gosier (metaLayer Inc) argues that “we need to democratize access to the tools used for understanding information by taking the hard-work out of drawing insight from excessive quantities of information”. Next, Luke Lonergan (Greenplum, a division of EMC) explores how businesses are using big data to connect with their customers, deliver new products or services faster and create a competitive advantage? Coco Krumme (MIT Media Lab) discussed the experiment conducted during the wine tasting the evening before. Pete Warden (Jetpac) talked about “the chaos out there”.
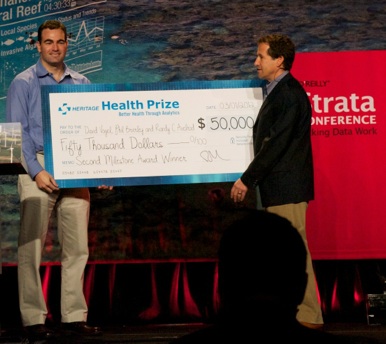
Next, Usman Haque (Pachube.com, see his picture below on the left) gave a very interesting talk about “The Internet of Things”. Sensors feeding data (e.g. radiation tracking in real time after the Fukushima disaster). Next, Richard Merkin (Heritage Provider Network) presented the Progress Prize on a health prediction problem.
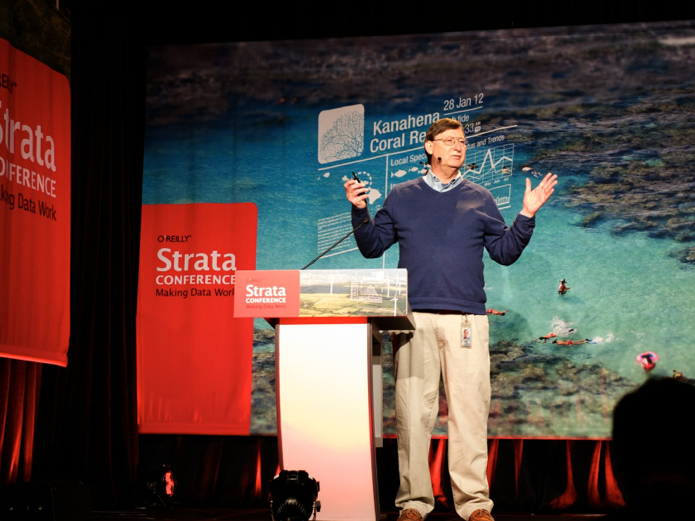
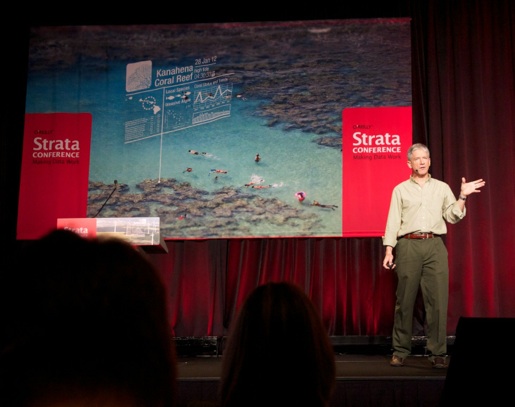
Finally, Hal Varian (Chief economist at Google, see picture at the top of this blog post) talked about using Google search data to predict economic data.

I was very curious what Jeremy Howard (@jeremyphoward, Kaggle, see picture below) was going to say in his talk “From Predictive Modelling to Optimization: The Next Frontier”. He started off by highlighting the importance to move from predictions to simulation and then to optimization, but to my great surprise he said that this is largely uncharted territory...??? what about the many papers about the topic of marketing optimization... including our own 2004 paper (using customer life-time value in a GA-framework to find the best marketing policy for each and every segment of customers). In the meantime, we continued to develop our programs, which has resulted in an HPC system for marketing optimization.
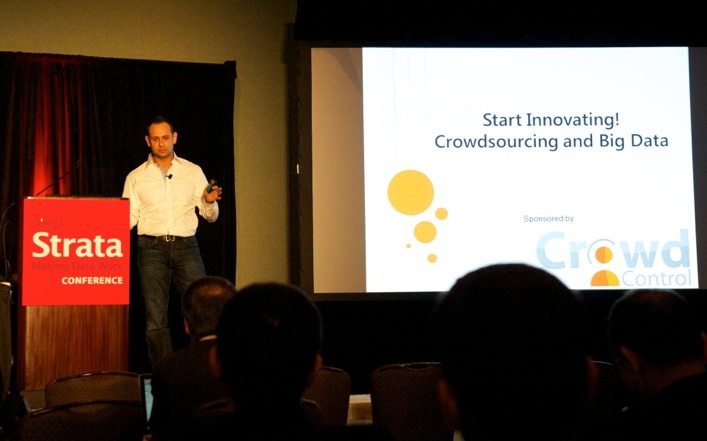
In the afternoon, I attended Max Yankelvich’ talk (CrowdControl Software) titled Start Innovating! Crowdsourcing and Big Data. According to Wikipedia crowdsourcing is a distributed problem-solving and production process that involves outsourcing tasks to a network of people, also known as the crowd. He gave many interesting examples how crowdsourcing has the potential to “change the world”. E.g. fully automated sentiment analysis may often break down in case of sarcasm. Crowdsourcing sentiment analysis may overcome this issue. Other applications include e.g. categorization: e.g. of medical doctors/specialists, government aid programs.
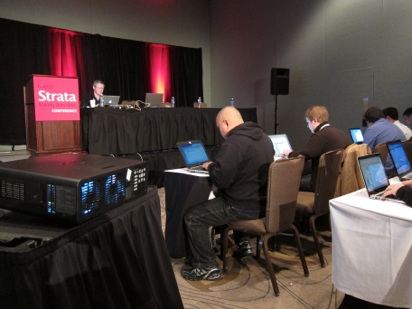
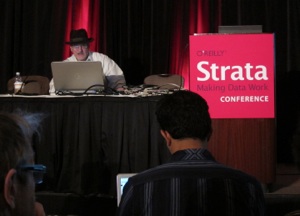
All throughout the conference, contributors were being interviewed and panel discussions were held, that were broadcast on the internet (see picture below of the “studio” setting).
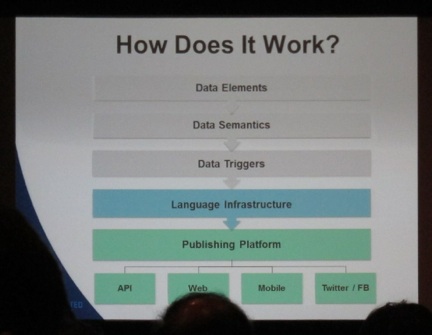
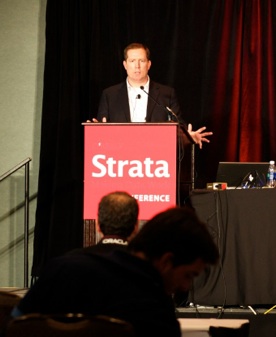
Next, Robbie Allen (Automated Insights, Inc.) talked about “From Big Data to Big Insights“. He has built a company making software to create long form narratives that rival humans in quality and depth. They automatically created over 100,000 articles covering College Basketball, College Football, NBA, NFL.

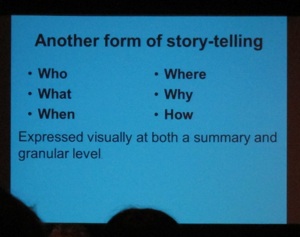
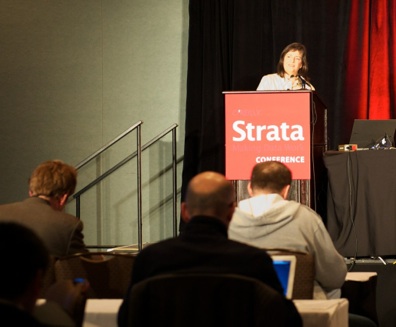
As the last talk of the conference, I attended Cheryl Phillips’ (The Seattle Times, see picture below) presentation titled “Exploring the Stories Behind the Data“. She emphasized the importance of using visualization of statistical data to highlight key points in a story. She talked about the so-called “nutgraf”. This is the 3rd or 4th paragraph of an article with the main objective to grasp the attention of the reader to motivate her/him to continue reading. In this sense, it talks about the WHY of the story, ideally supported by charts, stats, ... .
Of course, one can only attend one session at a time, whereas many interesting talks are going on in parallel, so I am pretty sure, I am doing injustice to many presenters I did not go to. Anyway, Strata 2012 was a huge success with excellent networking opportunities. Congratulations again to the organizers for a great job! All pictures shown on this page are my own (Copyright Dirk Van den Poel).